Disclosure: This post is for informational and educational purposes only. FinanceCompassPro.com may earn compensation through display advertising. We may also reference third-party products, services, or platforms by name for educational purposes – these mentions are not paid endorsements unless explicitly stated. Nothing in this post constitutes personalized financial, legal, tax, or investment advice.
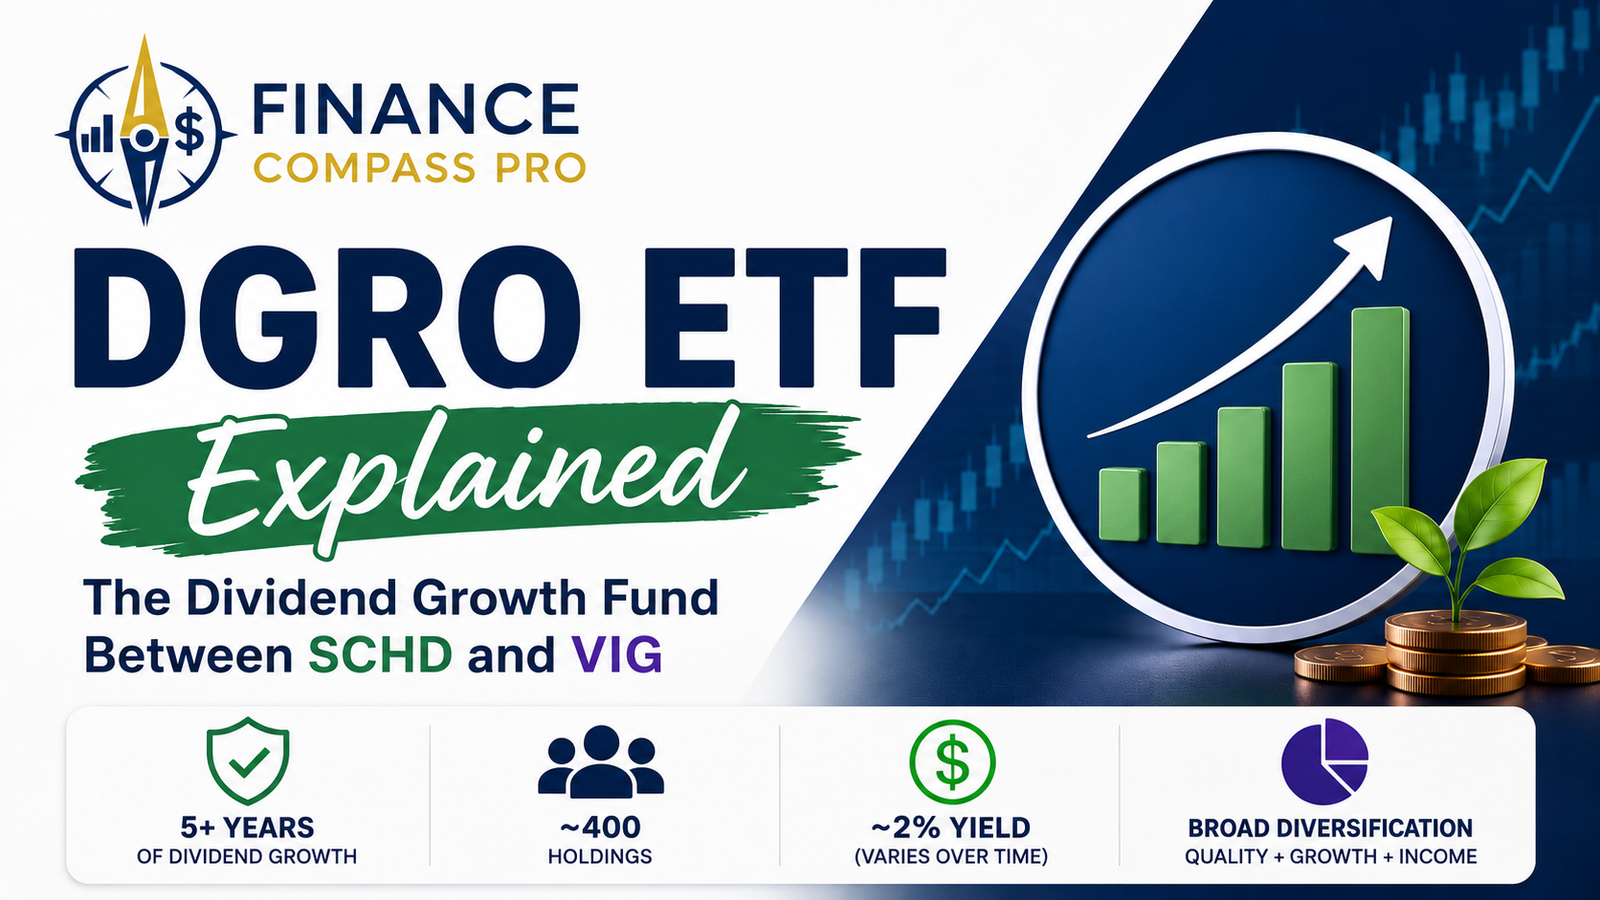
DGRO is one of the largest dividend-growth ETFs available, yet it gets less attention than SCHD or VIG. That’s a little surprising given its size – DGRO holds tens of billions in assets and tracks roughly 400 companies with a record of raising dividends.
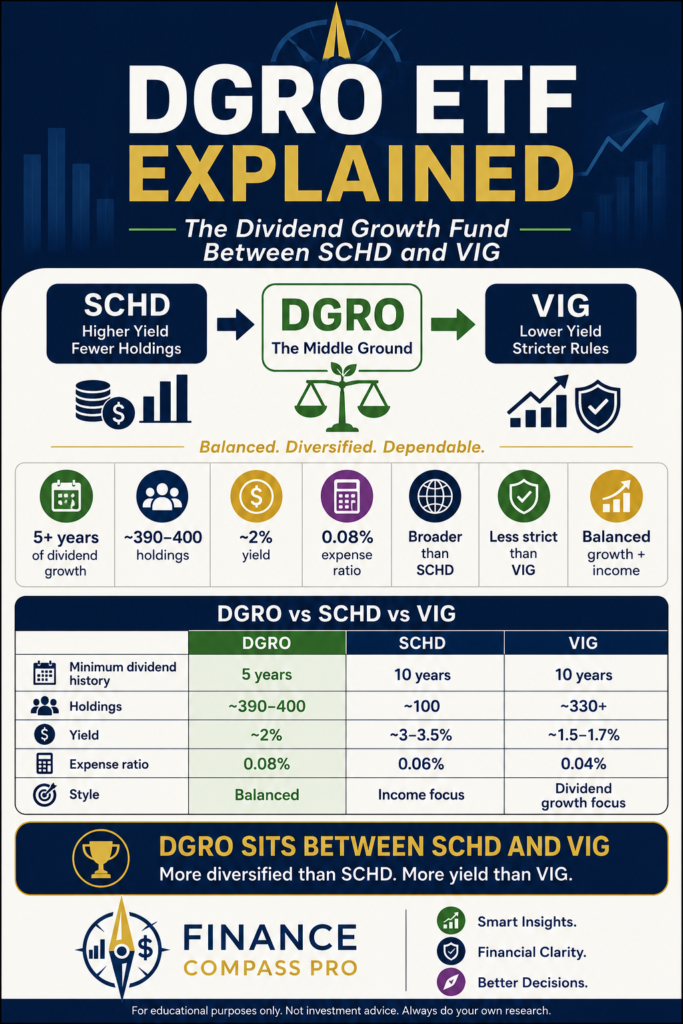
What makes DGRO different is its entry bar. Where VIG requires 10 consecutive years of dividend increases, DGRO’s index only requires 5. That single rule change reshapes the entire fund – more holdings, a different sector mix, and a meaningfully different risk profile.
This guide explains what DGRO actually holds, how its dividend-growth screen works, what it costs, and where the fund tends to fit in a diversified portfolio.
What Is DGRO?
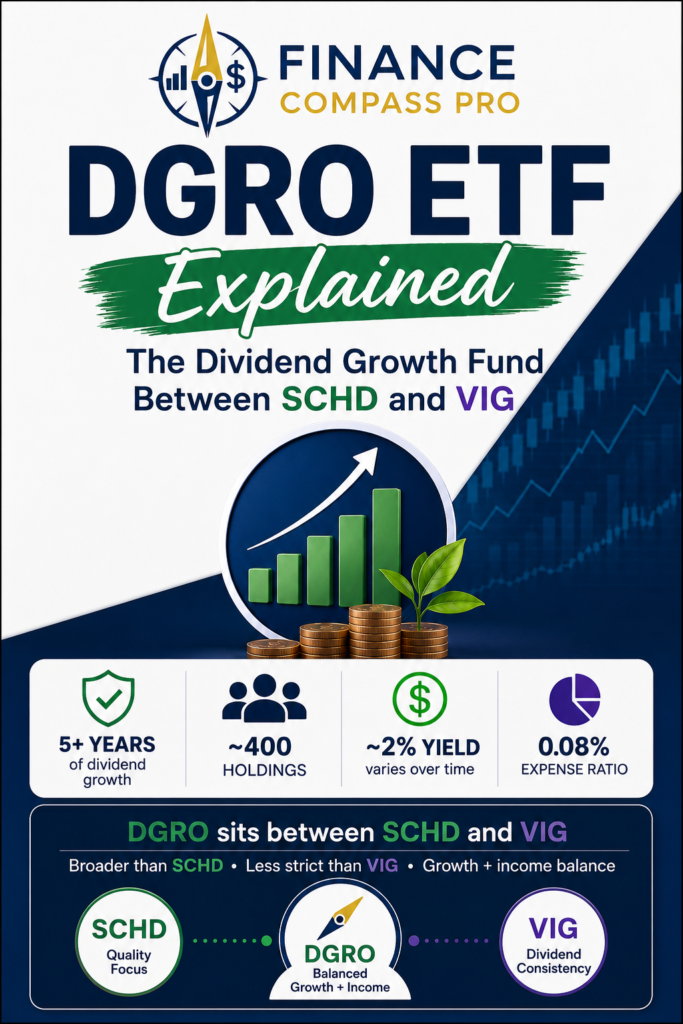
DGRO is the iShares Core Dividend Growth ETF. It tracks the Morningstar US Dividend Growth Index, which requires at least five years of uninterrupted annual dividend growth. The index also applies sustainability screens, including payout-ratio limits, and excludes the highest-yielding 10% of eligible companies to reduce exposure to potential yield traps.
That 5-year minimum is the defining feature of the fund. It’s a real screen, not just a high-yield label, but it’s a less restrictive dividend-history requirement than VIG’s 10-year bar. As a result, DGRO usually holds several times as many stocks as SCHD.
| Feature | DGRO ETF |
|---|---|
| Full name | iShares Core Dividend Growth ETF |
| Index tracked | Morningstar US Dividend Growth Index |
| Minimum dividend growth | 5+ consecutive years of increases |
| Expense ratio | 0.08% |
| Issuer | BlackRock (iShares) |
| Number of holdings | ~390-400, varies over time |
| Dividend yield | around 2%, varies over time |
| Launched | 2014 |
For official fund details, see the iShares DGRO product page. Yields and holdings fluctuate over time – verify current figures before investing.
What Does DGRO Actually Hold?
DGRO holds roughly 400 stocks across nearly every sector. Financial services, healthcare, and technology typically make up the largest sector weights, with consumer staples and industrials close behind. Top holdings have historically included large, familiar names like JPMorgan Chase, Johnson & Johnson, Apple, and Microsoft.
Because the index excludes the highest-yielding 10% of eligible stocks – a rule designed to filter out yield traps – DGRO doesn’t chase current income the way a fund like VYM does. Instead, it leans toward companies with a demonstrated, moderate, and growing payout.
The practical result is a fund that looks more like a broad, quality-tilted slice of the U.S. market than a concentrated income play. DGRO’s broader holdings usually produce a less concentrated sector profile than SCHD’s more selective approach.
How DGRO Differs From Other Dividend-Growth ETFs
DGRO’s defining distinction is its 5-year dividend-growth requirement combined with payout-ratio and sustainability screens. That gives it a broader portfolio than more selective dividend-growth funds while still filtering out the highest-yielding names.
If your decision is specifically DGRO versus SCHD, see SCHD vs. DGRO. If you are comparing DGRO with VIG, see VIG vs. DGRO. Those dedicated comparisons handle the side-by-side choice; this page stays focused on DGRO itself.
Diversification: DGRO’s Biggest Advantage
With roughly 400 holdings, DGRO is far more diversified than SCHD’s 100-stock portfolio. No single company or sector dominates the fund the way concentrated dividend funds can be affected by their top holdings.
That diversification comes with a tradeoff, though. Because the screen is less restrictive, DGRO includes some companies with shorter or less robust dividend-growth histories than SCHD’s more selective approach would allow. The fund balances this with its payout-ratio and sustainability filters, but it is still a less concentrated quality bet than SCHD.
Performance: Has DGRO Kept Up?
Since its 2014 launch, DGRO has been competitive with other major dividend-growth ETFs over many periods, though relative performance depends heavily on the start date, end date, and market environment. Some analysts have pointed out that DGRO’s broader dividend-growth screen and sector exposure – including more technology than SCHD typically holds – has helped it in markets led by large-cap growth.
That said, past performance among similar dividend-growth funds varies meaningfully by time period, and a fund that benefited from a particular market environment can just as easily lag in a different one. None of these funds – DGRO, SCHD, or VIG – has a permanent performance edge over the others.
Expense Ratio: The Middle of the Pack
DGRO charges 0.08%, which sits above both SCHD (0.06%) and VIG (0.04%). On a $10,000 investment, that’s an $8 annual fee versus $6 for SCHD or $4 for VIG – a small dollar gap, but DGRO is the most expensive of the three.
All three funds remain inexpensive by any broader standard. For more on how expense ratios compound over time, see ETF Expense Ratios Explained.
Tax Considerations
DGRO’s roughly 2% yield sits between VIG’s lower yield and SCHD’s higher one, which means its annual tax drag in a taxable account also falls in between.
Many distributions from U.S. equity ETFs like DGRO may qualify for the lower qualified-dividend tax rate if holding-period requirements are met, but your Form 1099-DIV is the source of truth each year.
Are DGRO Dividends Qualified?
Most of DGRO’s dividends have historically been reported as qualified, since the fund holds U.S. companies with long dividend-growth track records – the type of holding that typically meets the payer and holding-period requirements for qualified treatment.
That said, DGRO’s exact qualified-versus-ordinary split can vary by year and is confirmed on your Form 1099-DIV, not by the fund’s category alone. For how that distinction actually works – and why account type can override it entirely – see Qualified vs. Ordinary Dividends.
For a full breakdown of how account placement affects after-tax returns across different ETF types, see ETF Taxes Explained.
Who Should Consider DGRO?
- Investors who want broader diversification than SCHD’s concentrated 100-stock portfolio
- Investors who want a dividend-growth tilt without VIG’s stricter 10-year requirement
- Investors who want a single fund that blends current income and dividend growth rather than choosing one extreme
Investors who specifically want SCHD’s higher current yield, or VIG’s stricter quality bar and lower fee, may prefer those funds individually instead.
Where DGRO Fits in a Portfolio
Like other dividend-growth funds, DGRO works best as a satellite position layered on top of a broad core holding such as VOO or VTI, rather than as a complete portfolio by itself. Because DGRO already holds roughly 400 companies, pairing it with SCHD or VIG can create meaningful overlap – it’s worth checking holdings before stacking multiple dividend funds together.
For a full framework on combining core and satellite positions, see The 3-ETF Portfolio Strategy. If you’re still deciding how much of your portfolio should be in dividend-focused funds versus broad market exposure, our guide on asset allocation covers that tradeoff in more depth.
The Bottom Line
DGRO occupies a middle ground in the dividend-growth ETF space. Its 5-year minimum dividend-growth requirement is less restrictive than VIG’s 10-year bar, but its payout-ratio and sustainability screens still filter out the riskiest high-yield names. The result is a broadly diversified fund – roughly 400 holdings – that blends moderate current income with a real dividend-growth screen.
It costs slightly more than SCHD or VIG, but for investors who want broader diversification without giving up a dividend-quality filter entirely, DGRO fills a gap that neither of the other two funds covers exactly.
Once you understand DGRO’s screen and portfolio role, compare it only when a specific alternative would change your decision rather than stacking similar dividend funds by default.
For the broader picture of how core, dividend, international, bond, and growth ETFs fit together, see ETFs for Beginners: How to Choose, Compare, and Build a Simple Portfolio.