Disclosure: This post is for informational and educational purposes only. FinanceCompassPro.com may earn compensation through display advertising. We may also reference third-party products, services, or platforms by name for educational purposes – these mentions are not paid endorsements unless explicitly stated. Nothing in this post constitutes personalized financial, legal, tax, or investment advice.
When I first started investing, I spent a lot of time comparing ETFs by their returns.
VOO vs. SPY. QQQ vs. VTI. One chart after another.
What I barely looked at was the cost. And that turned out to be a mistake – because the cost of an ETF compounds over time just like returns do. Only in reverse.
Ever wondered why two ETFs tracking the same index have slightly different returns? Or why advisors always say “watch the expense ratio”? This guide explains exactly what is happening. And what it means for your money over 10, 20, or 30 years.
What Is an Expense Ratio?
An expense ratio is the annual fee that an ETF charges to cover its operating costs.
It is expressed as a percentage of your investment. The fee is deducted automatically from the fund’s assets. So you never write a check or see it leave your account directly.
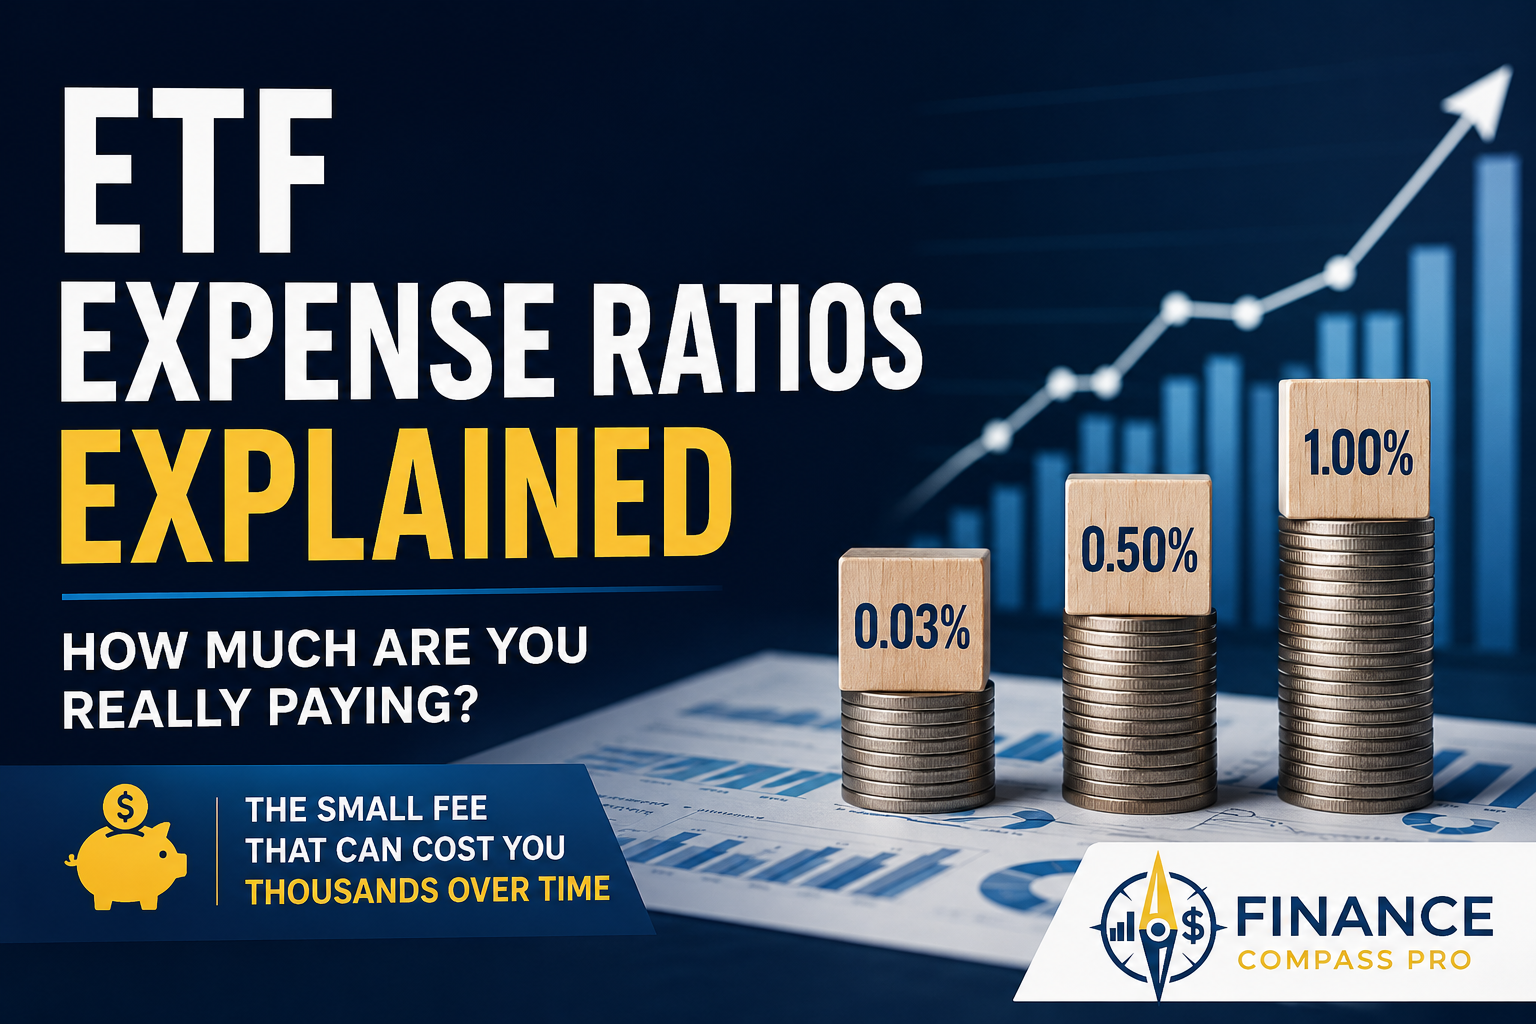
For example, invest $10,000 in a 0.03% expense ratio ETF. You pay roughly $3 per year. But if the expense ratio is 1.00%, you pay $100 per year on that same $10,000.
That difference sounds small. Over decades, it is not.

How Expense Ratios Work in Practice
The fee is not charged as a single annual deduction. Instead, the fund applies it daily as a fraction of your total assets. The fund manager uses the fee to pay for portfolio management, administration, legal costs, and other operational expenses.
Your brokerage account shows the net asset value (NAV) of the fund after fees have already been applied.
That is why people sometimes call expense ratios “invisible fees.” They quietly reduce your returns without any visible transaction.
If you are newer to how ETFs work, start with the basics first. What Is an ETF and How Does It Work covers the full picture before diving into costs.
Why Expense Ratios Matter More Than Most People Think
Here is the part that surprises most beginners.
A 1% expense ratio does not just cost you 1% of your money each year. It costs you 1% of every dollar you have invested. That includes the dollars your investments have already earned. So the fee compounds against you over time.
Let’s look at a real comparison.
| Scenario | Initial Investment | Annual Return (before fees) | Expense Ratio | Value After 30 Years |
|---|---|---|---|---|
| Low-cost ETF | $10,000 | 7% | 0.03% | ~$76,100 |
| Mid-cost ETF | $10,000 | 7% | 0.50% | ~$66,100 |
| High-cost ETF | $10,000 | 7% | 1.00% | ~$57,400 |
The difference between a 0.03% and a 1.00% expense ratio on a $10,000 investment is roughly $18,000 to $18,500 over 30 years. That depends on how fees are modeled.
That is not a small rounding error. That is a meaningful portion of your retirement savings.
What Counts as a Low, Average, or High Expense Ratio?
Expense ratios vary significantly depending on the type of fund and how it is managed. For example, broad index ETFs charge far less than actively managed funds.
| Fund Type | Typical Expense Ratio Range | Examples |
|---|---|---|
| Broad index ETFs | 0.03% – 0.10% | VOO (0.03%), VTI (0.03%), IVV (0.03%) |
| International ETFs | 0.05% – 0.20% | VXUS (0.07%) |
| Bond ETFs | 0.03% – 0.15% | BND (0.03%) |
| Dividend ETFs | 0.06% – 0.35% | SCHD (0.06%), VYM (0.06%) |
| Sector ETFs | 0.10% – 0.60% | Varies widely |
| Actively managed funds | 0.50% – 1.50%+ | Varies widely |
For most beginner investors focused on index ETFs, anything under 0.20% is generally considered low.
The major broad-market ETFs from Vanguard, BlackRock, and Schwab are all in the 0.03% to 0.10% range.
Expense Ratio vs. Other ETF Costs
The expense ratio is the most important ongoing cost to understand. However, it is not the only fee associated with ETFs.
Here is how it compares to other costs you might encounter.
| Cost Type | What It Is | How to Avoid or Minimize It |
|---|---|---|
| Expense ratio | Annual operating fee, deducted from fund assets | Choose low-cost index ETFs |
| Trading commission | Fee to buy or sell ETF shares | Most major brokerages now offer $0 commissions |
| Bid-ask spread | Difference between buy and sell price at any moment | Trade popular, high-volume ETFs during market hours |
| Tax drag | Taxes owed on dividends and capital gains distributions | Hold ETFs in tax-advantaged accounts when possible |
For many long-term investors using large index ETFs, the expense ratio is the easiest ongoing cost to compare. However, it is not the only cost that can affect your real return. Tax drag, in particular, can matter more than the expense ratio in taxable accounts. For a full breakdown of how dividends and capital gains are taxed, see ETF Taxes Explained. For bond ETFs specifically, see AGG vs. BND, which compares two of the cheapest core bond funds available.
Commissions have largely disappeared, and broad index ETFs tend to have narrow bid-ask spreads.
How to Compare Expense Ratios When Choosing an ETF
When two ETFs track the same index, the expense ratio becomes one of the clearest ways to choose between them. This comes up frequently with S&P 500 ETFs.
For example, VOO, IVV, and SPY all track the same S&P 500 index. Their expense ratios tell part of the story:
| ETF | Expense Ratio | Issuer |
|---|---|---|
| VOO | 0.03% | Vanguard |
| IVV | 0.03% | BlackRock (iShares) |
| SPY | 0.0945% | State Street (SPDR) |
SPY’s higher expense ratio is partly explained by its history. It was the first U.S.-listed ETF, launched in 1993.
Because of this, SPY remains the most actively traded ETF. Institutional traders prefer it for liquidity over cost. However, for long-term buy-and-hold investors, VOO or IVV typically make more sense on cost alone.
For long-term investors who buy and hold, VOO or IVV typically make more sense on cost alone.
For a deeper look at how these three compare on every dimension, VOO vs. SPY: Which S&P 500 ETF Should You Buy? walks through the full comparison.
And if you are deciding between VOO and IVV specifically, IVV ETF Explained covers the key differences.
The Case Against Obsessing Over Expense Ratios
Expense ratios matter – but not every cost difference is worth agonizing over.
The difference between a 0.03% expense ratio and a 0.06% expense ratio on a $10,000 investment is about $3 per year. That is not a decision worth spending significant time on. The more important factor is whether the ETF fits your strategy in the first place.
In addition, there are situations where paying a slightly higher expense ratio makes sense:
- You want exposure to a specific sector or theme with no low-cost alternative
- The ETF’s strategy meaningfully differs from cheaper alternatives
- You are using a dividend-focused ETF where the strategy, screening method, and total-return profile may justify a slightly higher fee
For example, SCHD has a 0.06% expense ratio. That is slightly above the cheapest broad-market ETFs. However, its active screening for dividend quality is what makes it worth comparing against simpler options. SCHD Explained covers how its methodology works.
The real concern is funds charging 0.50% or more for passive index exposure that could be replicated for a fraction of the cost.
That is where the math works against you meaningfully over time.

Expense Ratios Across the ETFs on This Site
Here is a quick reference for the expense ratios of ETFs covered on FinanceCompassPro, so you can compare them in one place.
| ETF | Expense Ratio | Category |
|---|---|---|
| VOO | 0.03% | U.S. large-cap / S&P 500 |
| VTI | 0.03% | U.S. total market |
| IVV | 0.03% | U.S. large-cap / S&P 500 |
| SPY | 0.0945% | U.S. large-cap / S&P 500 |
| BND | 0.03% | U.S. total bond market |
| VXUS | 0.07% | International (ex-U.S.) |
| SCHD | 0.06% | U.S. dividend equity |
| VYM | 0.06% | U.S. high dividend yield |
| QQQ | 0.18% | Nasdaq-100 / tech-heavy |
| VNQ (REIT ETF) | 0.13% | U.S. real estate |
Notice that QQQ still stands out as more expensive than broad-market ETFs like VOO, VTI, and IVV. That is true even after its expense ratio dropped from 0.20% to 0.18%.
In late 2025, QQQ converted from a unit investment trust (UIT) to an open-ended ETF. This structural change also allows it to use in-kind redemptions. As a result, it can minimize taxable capital gains distributions.
For context on whether that cost is worth it given QQQ’s growth focus, QQQ vs. VOO breaks down the trade-offs in detail.
How to Find an ETF’s Expense Ratio
Expense ratios are publicly available and easy to find. Here are the most reliable sources:
- The fund provider’s website – Vanguard, BlackRock (iShares), and Schwab all list expense ratios prominently on each fund’s product page
- ETF.com or Morningstar – Both sites allow you to search any ETF and see its expense ratio alongside other key data
- Your brokerage platform – Most brokerages display expense ratios on the ETF’s detail page before you invest
- The fund’s prospectus – The official legal document for any ETF will list fees in the “Fees and Expenses” section
Therefore, always confirm the current expense ratio before investing, as fund companies occasionally adjust them.
Expense Ratios and the 3-ETF Portfolio
One reason the 3-ETF strategy is so popular is that it naturally steers you toward low-cost funds. A U.S. stock ETF, an international ETF, and a bond ETF are all available for under 0.10% from major providers.
If you invest $10,000 across a typical 3-ETF setup, your blended expense ratio comes to around 0.04% to 0.06% per year. On $10,000, that is $4 to $6 annually. Less than a cup of coffee.
Some investors simplify this even further with VT ETF, which combines U.S. and international stocks into one fund at a similarly low expense ratio. That turns a 3-ETF setup into a 2-fund portfolio.
For a full breakdown of how to build that portfolio, The 3-ETF Portfolio Strategy walks through the specific funds, allocation percentages, and how to get started.
What the Expense Ratio Does Not Tell You
The expense ratio is an important input, but it is not the only factor that determines whether an ETF is right for you.
Here are things the expense ratio does not capture:
- Tracking error – How closely the ETF follows its index. A fund can have a low expense ratio but still underperform its benchmark if it does not track well.
- Tax efficiency – Some ETFs distribute more taxable dividends or capital gains than others, which affects your after-tax return.
- Strategy fit – A 0.06% dividend ETF might be a better fit for your goals than a 0.03% broad-market ETF, depending on what you are trying to accomplish.
- Liquidity – Very small or thinly traded ETFs can have wider bid-ask spreads that add to your real cost, even with a low expense ratio.
For most beginners building a long-term portfolio with major index ETFs, the expense ratio is the most straightforward cost to check first. However, use it alongside other factors, not instead of them.
Final Thought
The expense ratio is one of those concepts that sounds technical but comes down to one simple question: how much of your investment return are you keeping?
In the world of index ETFs, the answer is: almost all of it. The major broad-market funds charge so little that cost is almost not a factor.
Where expense ratios become more relevant is when you are comparing specialized ETFs, sector funds, or trying to understand why two similar funds have slightly different returns over time.
Before buying any ETF, take ten seconds to check the expense ratio. It is one of the few investment costs you can control entirely. And controlling costs is one of the clearest ways to improve your long-term returns.
Still building your first portfolio? See how these costs fit into a broader strategy. Best ETFs for Beginners is a good next step.