Disclosure: This post is for informational and educational purposes only. FinanceCompassPro.com may earn compensation through display advertising. We may also reference third-party products, services, or platforms by name for educational purposes – these mentions are not paid endorsements unless explicitly stated. Nothing in this post constitutes personalized financial, legal, tax, or investment advice.
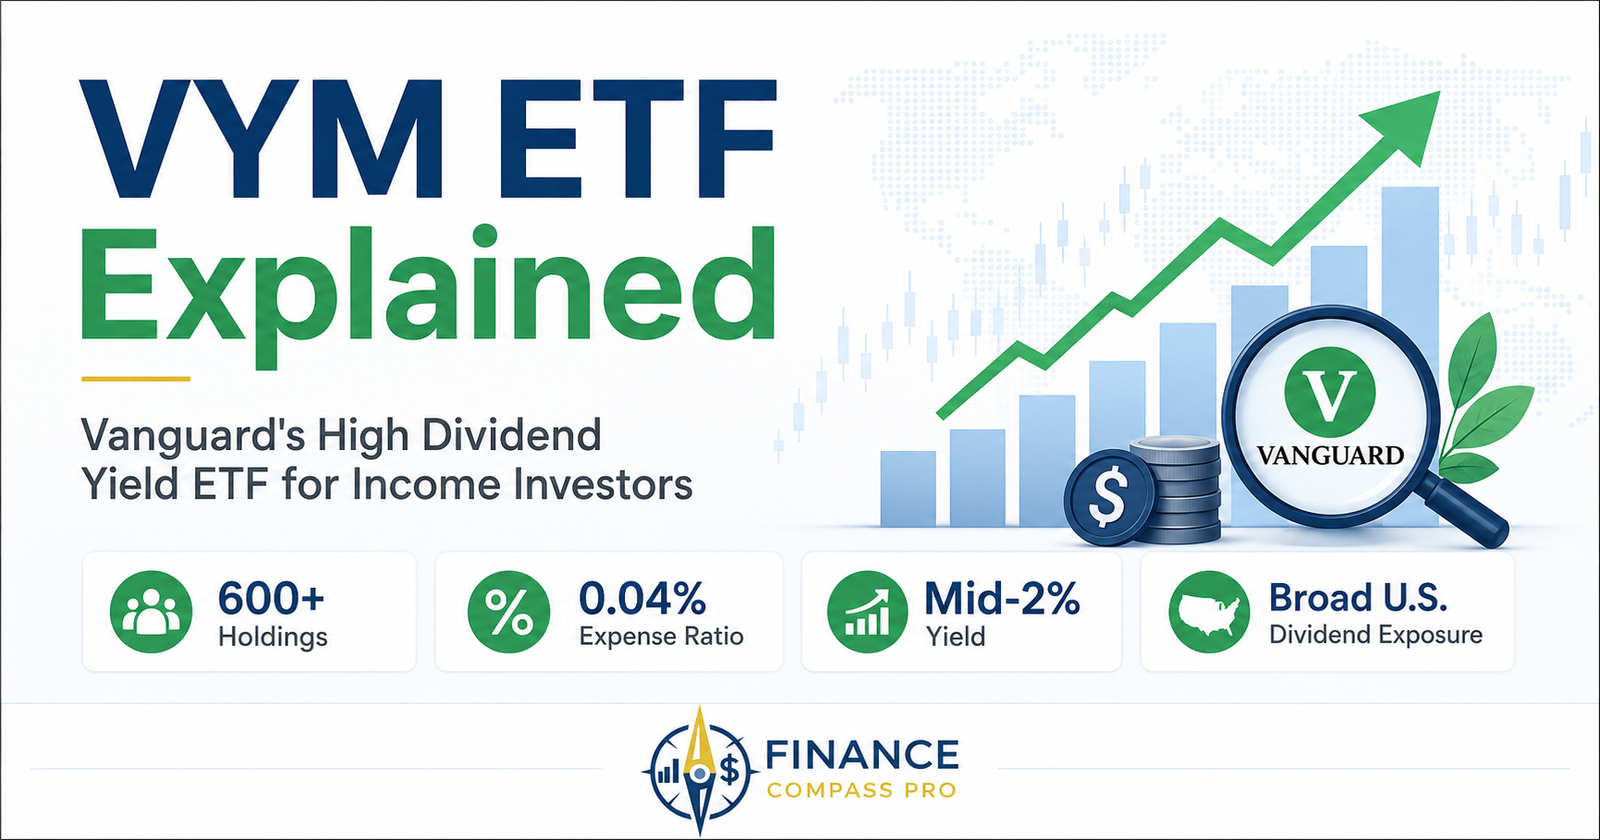
VYM is one of the most straightforward dividend ETFs available. It does not apply complex quality screens or rank companies on financial ratios. Instead, it takes a simpler approach: find U.S. stocks that pay above-average dividends, hold all of them, and keep the cost as low as possible.
The result is a fund with over 600 holdings, a yield that typically runs higher than VIG but lower than SCHD, and one of the lowest expense ratios among major dividend ETFs. For investors who want broad income exposure without paying for a tighter screen, VYM is worth understanding.
This guide covers what VYM actually holds, how its simpler approach compares to SCHD and VIG, and where it tends to fit in a beginner portfolio.
What Is VYM?
VYM is the Vanguard High Dividend Yield ETF. It tracks the FTSE High Dividend Yield Index, which screens U.S. companies for above-average dividend yields, then holds all of them on a market-cap-weighted basis. REITs are excluded from the index.
The key word is “high yield.” Unlike VIG, which screens for 10 years of dividend growth, or SCHD, which applies a multi-factor quality score, VYM uses a simpler screen focused on above-average dividend yields, while excluding REITs and weighting holdings by market capitalization. The result is a much broader fund with significantly more holdings than either of those alternatives.
| Feature | VYM ETF |
|---|---|
| Full name | Vanguard High Dividend Yield ETF |
| Index tracked | FTSE High Dividend Yield Index |
| Screening method | Above-average dividend yield; excludes REITs |
| Expense ratio | 0.04% |
| Issuer | Vanguard |
| Number of holdings | ~600+, varies over time |
| Dividend yield | usually in the mid-2% range, varies over time |
| Launched | 2006 |
For official fund details, see the Vanguard VYM product page. Yields and holdings fluctuate over time – verify current figures before investing.

What Does VYM Actually Hold?
VYM holds over 600 U.S. stocks across a wide range of sectors. Financials, consumer staples, healthcare, industrials, and energy tend to make up the largest allocations. Technology has historically been underrepresented compared to broad-market funds like VOO or VTI, since many large tech companies either pay no dividend or pay a modest one that does not qualify as “above average.”
Top holdings have historically included names like Broadcom, JPMorgan Chase, Exxon Mobil, Johnson & Johnson, and Chevron. The fund is market-cap weighted, so larger companies make up a bigger share of the portfolio. However, the top 10 holdings together represent roughly 25% of the fund – significantly less concentration than SCHD’s top 10.
Because VYM includes any company with an above-average yield, it captures a wide range of dividend-paying companies without applying a quality score or growth requirement. That breadth is both VYM’s main advantage and its main limitation.
VYM vs. SCHD and VIG: The Short Version
VYM, SCHD, and VIG are the three funds beginners compare most often when choosing a dividend ETF. Each applies a different screen to the same basic idea.
VYM’s screen is the least selective of the three – it holds more companies and applies fewer filters than either SCHD or VIG.
For a direct comparison of SCHD and VYM, see VYM vs. SCHD. For how VIG compares to SCHD across yield, sector exposure, and taxes, see SCHD vs. VIG.
The Case for VYM’s Broader Approach
VYM’s wider net has real advantages. With over 600 holdings, no single company or sector can dominate the fund the way SCHD’s more concentrated approach can. That diversification reduces company-specific risk and produces a more balanced sector profile across the portfolio.
Additionally, VYM’s approach avoids the risk of over-optimizing for any single factor. Funds that screen heavily on past financial ratios or dividend growth history can be vulnerable when market conditions shift and historically strong companies underperform. VYM’s simpler methodology may also be easier for beginners to understand and less dependent on a narrow set of quality metrics.
For a deeper look at how dividend-growth ETFs like VIG use a stricter screen, see VIG ETF Explained. For a middle-ground option with roughly 400 holdings and a 5-year dividend-growth requirement, see DGRO ETF Explained.
The Tradeoffs
VYM’s broader, less filtered approach also has limitations. Because it selects on yield alone, it can include companies that pay high dividends for the wrong reason – a falling stock price that inflates the yield rather than a genuinely strong business. SCHD’s multi-factor screen specifically tries to filter these out; VYM does not.
VYM also has less technology exposure than a broad-market fund, which can cause it to lag significantly during markets driven by large-cap tech growth. Investors who rely solely on VYM as their equity allocation miss much of the return from this sector.
Finally, VYM’s yield is usually in the mid-2% range, which is meaningful but sits below SCHD’s. Investors specifically seeking the highest current income among large, diversified dividend ETFs may find SCHD more suitable.
Expense Ratio: Tied with VIG at 0.04%
VYM charges 0.04%, the same as VIG and lower than SCHD’s 0.06%. On a $10,000 investment, that is $4 per year – essentially free in practical terms. All three funds are inexpensive. For investors choosing between them, the expense ratio is the least important factor.
For more on how fees compound over decades, see ETF Expense Ratios Explained.
Tax Considerations
VYM’s yield is usually in the mid-2% range, higher than VIG but often lower than SCHD. That generates more taxable dividend income annually than VIG in a taxable brokerage account, but less than SCHD’s higher payout. Many distributions from U.S. equity ETFs like VYM may qualify for the lower qualified-dividend tax rate if holding-period requirements are met, but your Form 1099-DIV is the authoritative source each year — see Qualified vs. Ordinary Dividends for exactly how that determination works.
Some investors prefer to hold higher-yielding dividend funds inside a Roth IRA or Traditional IRA to shelter the annual income from current taxation. For a full breakdown of how account placement affects after-tax returns, see ETF Taxes Explained. For a full guide on which ETF types benefit most from Roth IRA placement, see Best ETFs for Roth IRA.
Who Should Consider VYM?
- Investors who want broad exposure to dividend-paying U.S. stocks without a tightly filtered screen
- Investors who prefer diversification across 600+ holdings over a more concentrated 100-stock approach
- Investors who want a straightforward, low-cost income tilt paired with a broad-market core fund
- Investors who are comfortable with lower technology exposure in exchange for a higher starting yield than VIG
Investors who specifically want stricter quality filtering, higher current yield, or a dividend-growth focus should also compare SCHD and VIG before deciding.
Where VYM Fits in a Portfolio
VYM works best as a satellite position alongside a broad-market core holding like VOO or VTI, rather than as a complete portfolio by itself. Its low technology exposure means it will behave differently from a total-market fund during tech-led markets – sometimes as a diversifier, sometimes as a drag.
For example, some investors might pair a broad-market core such as VOO or VTI with a smaller VYM allocation for an income tilt. The exact percentage depends on risk tolerance, income needs, account type, and overall asset allocation.
Because VYM’s holdings overlap significantly with SCHD and VIG, stacking all three dividend funds together produces less additional diversification than it might appear. For a framework on core and satellite portfolio structure, see The 3-ETF Portfolio Strategy.
If you’re still deciding how much of your portfolio to put into dividend-oriented funds, see our guide on asset allocation.
The Bottom Line
VYM is the simplest and most broadly diversified of the three main dividend ETFs. It selects for above-average yield without applying the stricter quality or growth filters of SCHD and VIG. The result is a 600+ stock fund that offers meaningful income, low cost, and genuine diversification across the dividend-paying segment of the U.S. market.
It is not the best choice for investors who specifically want the highest income, the most rigorous quality screen, or the strongest dividend-growth track record. However, for investors who want broad, low-cost income exposure as part of a larger portfolio, VYM earns its place.
For a full comparison of the dividend ETF landscape, VYM vs. SCHD covers the most common decision beginners face, and SCHD vs. VIG explains the tradeoff between high current yield and dividend growth.
For the broader picture of how core, dividend, international, bond, and growth ETFs fit together, see ETFs for Beginners: How to Choose, Compare, and Build a Simple Portfolio.