Disclosure: This post is for informational and educational purposes only. FinanceCompassPro.com may earn compensation through display advertising. We may also reference third-party products, services, or platforms by name for educational purposes – these mentions are not paid endorsements unless explicitly stated. Nothing in this post constitutes personalized financial, legal, tax, or investment advice.
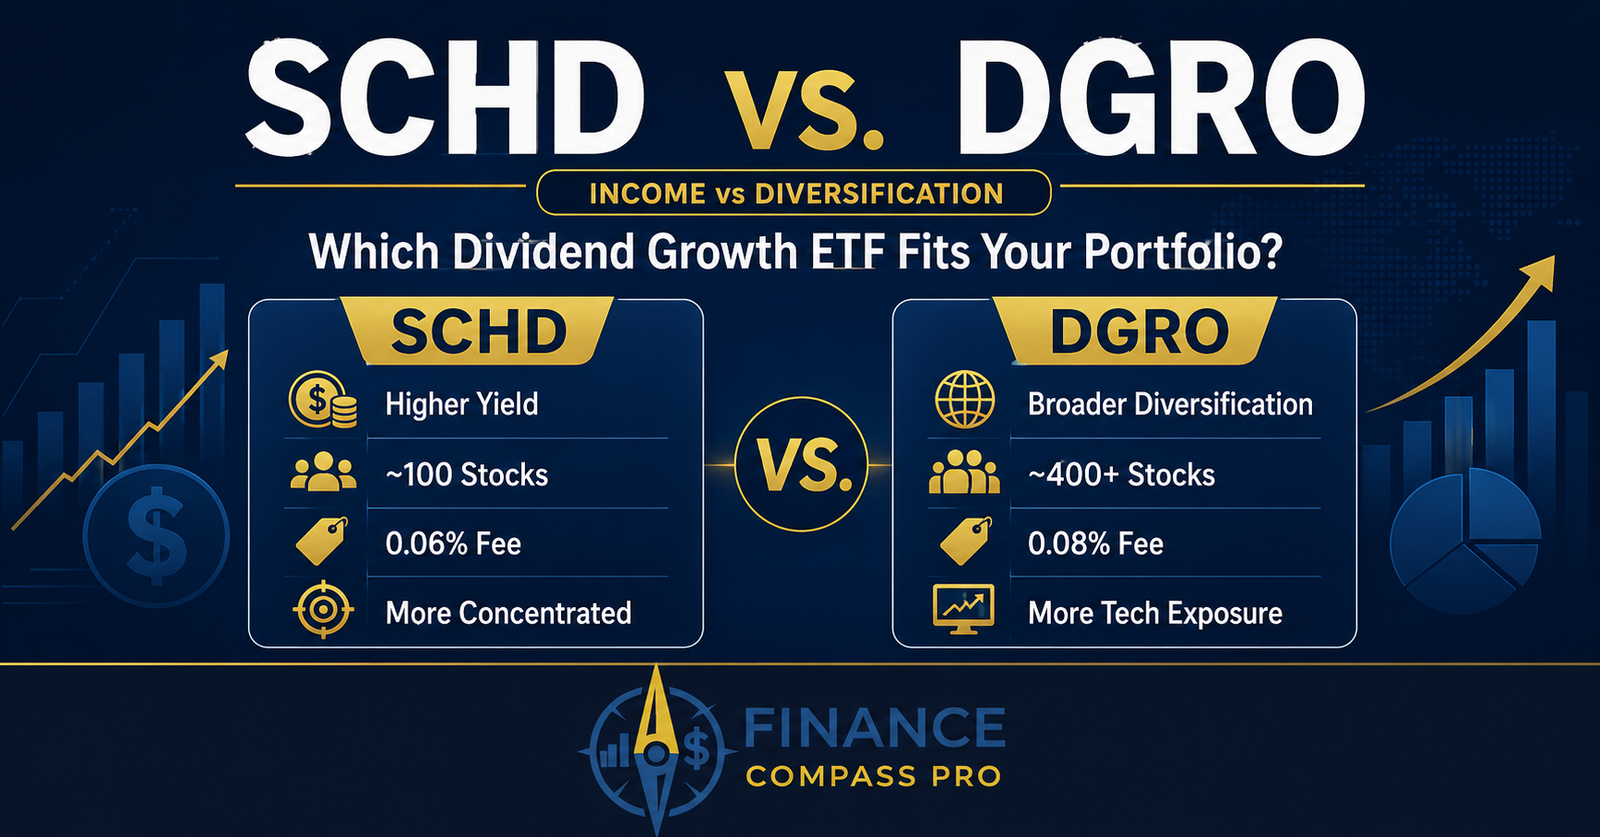
SCHD yields around 3% from a concentrated 100-stock portfolio at a 0.06% expense ratio. DGRO yields closer to 1.5-2.5% but spreads across 400+ holdings at a 0.08% expense ratio. The trade-off in one line: SCHD for higher current income, DGRO for broader diversification and more tech exposure.
SCHD and DGRO are two of the most discussed dividend ETFs in the same conversation – and for good reason. Both screen for dividend quality. Both can serve as the dividend-focused portion of a long-term portfolio.
However, they answer a different question. SCHD asks: which 100 high-yielding U.S. companies have the strongest fundamentals? DGRO asks: which U.S. companies have consistently grown their dividends for at least five years, while keeping their payout sustainable? That single difference in philosophy produces a higher-yield, more concentrated fund versus a lower-yield, much more diversified one.
This guide breaks down what each fund holds, where their differences actually show up, and how to decide which one – or whether a combination of both – fits your portfolio.
What Do SCHD and DGRO Actually Track?
SCHD tracks the Dow Jones U.S. Dividend 100 Index. The index screens for U.S. companies with at least 10 consecutive years of dividend payments, then scores each on four fundamental factors: cash flow to total debt, return on equity, dividend yield, and five-year dividend growth rate. The top 100 by composite score make the final portfolio.
DGRO tracks the Morningstar US Dividend Growth Index. This index requires at least five consecutive years of uninterrupted dividend growth, applies a payout-ratio filter to screen out unsustainable dividends, and excludes the top 10% of eligible stocks by current yield – a rule designed to keep the fund away from potential yield traps. The result is a much broader portfolio of roughly 400 companies.
| Feature | SCHD | DGRO |
|---|---|---|
| Full name | Schwab U.S. Dividend Equity ETF | iShares Core Dividend Growth ETF |
| Issuer | Schwab | BlackRock (iShares) |
| Index tracked | Dow Jones U.S. Dividend 100 | Morningstar US Dividend Growth Index |
| Min. dividend history | 10 years of payments | 5 years of growth |
| Number of holdings | ~100 | ~400+, varies over time |
| Expense ratio | 0.06% | 0.08% |
| Dividend yield | usually in the 3% range, varies over time | usually in the 1.5-2.5% range, varies over time |
| Launched | 2011 | 2014 |
For official fund details, see the Schwab SCHD product page and the iShares DGRO product page. Yields and holdings fluctuate over time – verify current figures before investing.

Yield: SCHD Has the Higher Current Yield
This is the most visible difference between the two funds. SCHD’s dividend yield typically runs in the 3% range. DGRO’s yield is usually between 1.5% and 2.5%, depending on market conditions and the measurement date. Both vary over time – always verify current figures on the fund sponsor’s website.
The gap exists by design. SCHD’s index deliberately selects for yield as one of its four scoring factors, pulling higher-yielding companies into the portfolio. DGRO’s index does the opposite – it actively excludes the top 10% of eligible stocks by current yield to keep the fund focused on dividend growth rather than current income.
The practical implication: SCHD usually generates more annual dividend income per dollar invested than DGRO, although the exact gap changes over time. However, higher yield does not automatically mean better total returns – as the performance history of both funds illustrates.
Diversification: DGRO Holds Far More Stocks
SCHD’s 100-stock portfolio is concentrated by design. Its index applies a strict composite score across four financial metrics, selecting only the highest-ranked names. That concentration can produce strong outcomes when SCHD’s selection criteria identify quality companies – but it also means any single sector rotation can meaningfully affect the fund’s performance.
DGRO usually holds several hundred companies, making it much broader than SCHD’s roughly 100-stock portfolio. No single company or sector dominates the portfolio the way SCHD’s top holdings can. As a result, DGRO’s sector profile tends to be more balanced, with meaningful allocations to technology, financials, and healthcare rather than the more value- and income-tilted sector mix of SCHD.
Specifically, DGRO’s inclusion of technology companies – which often grow dividends steadily from a low starting yield – gives it more tech exposure than SCHD typically carries. That difference drives much of the performance gap between the two funds in tech-led market environments.
Performance: Close Over the Long Run, Different Year to Year
Over long periods, DGRO and SCHD have delivered broadly similar total returns, though the gap between them shifts depending on which market environment is measured. DGRO has led in some periods, while SCHD has led in others, depending heavily on the start date, end date, and market environment.
Neither fund has a durable, consistent performance advantage over the other. The primary driver of any year-to-year gap is sector rotation – specifically whether technology or value and income stocks are leading the market at a given time. As a result, investors should not choose between them based on recent performance alone.
Past performance does not predict future results. Both funds carry equity risk, and both can decline significantly during broad market selloffs. The differences in volatility between them have been modest historically.
Expense Ratio: SCHD Has a Slight Edge
SCHD charges 0.06% per year. DGRO charges 0.08%. On a $10,000 investment, that is a $2 annual difference – not meaningful in isolation. However, over decades of compounding, small fee differences do matter. For more on how expense ratios compound over time, see ETF Expense Ratios Explained.
Both funds are inexpensive by any standard. The fee gap should not be the deciding factor – the yield, diversification, and sector differences matter far more.
Tax Considerations
Because SCHD usually has a higher yield than DGRO, it generally generates more taxable dividend income each year in a taxable brokerage account. Many distributions from U.S. equity ETFs like SCHD and DGRO may qualify for the lower qualified-dividend tax rate if holding-period requirements are met, but your Form 1099-DIV is the source of truth each year.
For investors with meaningful positions in taxable accounts, SCHD’s higher yield creates more annual tax drag than DGRO’s. This is why higher-yielding funds like SCHD are often discussed as candidates for tax-advantaged accounts, while lower-yielding growth-oriented funds may create less annual tax drag in taxable accounts. For the full framework on account placement, see ETF Taxes Explained.
Can You Hold Both?
Yes. SCHD and DGRO are not identical funds, and combining them gives a dividend portfolio that blends SCHD’s higher current yield with DGRO’s broader sector diversification and lower yield concentration. Their sector exposures pull in somewhat different directions, particularly around technology.
However, they still tend to behave like equity funds during broad market declines. Holding both does not eliminate dividend equity risk or provide strong downside protection. For investors considering adding a third dividend ETF, see SCHD vs. VIG to understand how VIG’s stricter 10-year dividend growth requirement fits alongside SCHD and DGRO.
Beginner Decision: SCHD or DGRO?
This is the practical question this comparison creates. Here is how to think through it.
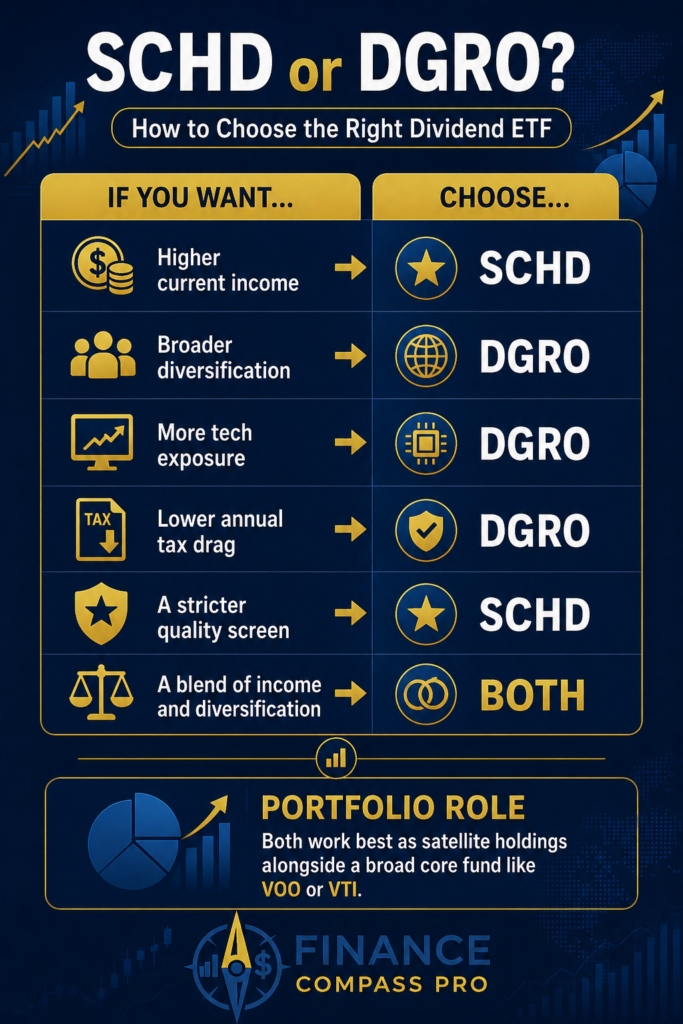
| If you prioritize… | Consider… |
|---|---|
| Higher current income from your dividend allocation | SCHD |
| Broader diversification across 400+ companies | DGRO |
| More technology exposure within a dividend fund | DGRO |
| A stricter quality screen on fewer, higher-conviction names | SCHD |
| Lower annual tax drag in a taxable account | DGRO |
| Blending income and diversification | Both |
The key insight: SCHD and DGRO are not competing for the same job. SCHD is built for investors who want the highest quality income from a concentrated screen. DGRO is built for investors who want broad dividend-growth exposure without concentrating in a small number of names. Neither is objectively superior – the right choice depends on your income needs, tax situation, and how much concentration you are comfortable with.
Where SCHD and DGRO Fit in a Portfolio
Both funds work best as a satellite position alongside a broad core holding such as VOO or VTI, rather than as a complete portfolio on their own. For example, some investors use a broad-market fund as the core and add a smaller dividend ETF allocation as a satellite for income or dividend-growth exposure. The exact percentage depends on risk tolerance, income needs, account type, and overall asset allocation.
For a complete framework on combining a core fund with a dividend satellite, see The 3-ETF Portfolio Strategy. If you are still deciding how much of your overall portfolio to allocate to dividend-oriented funds versus broad market exposure, see our guide on asset allocation.
The Bottom Line
SCHD and DGRO take fundamentally different approaches to dividend investing. SCHD applies a strict four-factor quality score to 100 names, producing higher current yield and more concentration. DGRO casts a wider net across 400+ companies with a five-year dividend growth requirement, producing lower yield and broader diversification.
For long-term investors, neither fund has proven decisively superior in total return over all market environments. The choice between them depends on whether you value income now or broader sector exposure – and both answers are reasonable depending on your goals and tax situation.
For individual fund breakdowns, see SCHD ETF Explained and DGRO ETF Explained. If you are comparing dividend ETFs more broadly, SCHD vs. VIG covers the yield-versus-growth tradeoff, VIG vs. DGRO compares two growth-leaning dividend ETFs, and Best Dividend ETFs gives you a wider side-by-side overview.
For the broader picture of how core, dividend, international, bond, and growth ETFs fit together, see ETFs for Beginners: How to Choose, Compare, and Build a Simple Portfolio.