Disclosure: This post is for informational and educational purposes only. FinanceCompassPro.com may earn compensation through display advertising. We may also reference third-party products, services, or platforms by name for educational purposes – these mentions are not paid endorsements unless explicitly stated. Nothing in this post constitutes personalized financial, legal, tax, or investment advice.
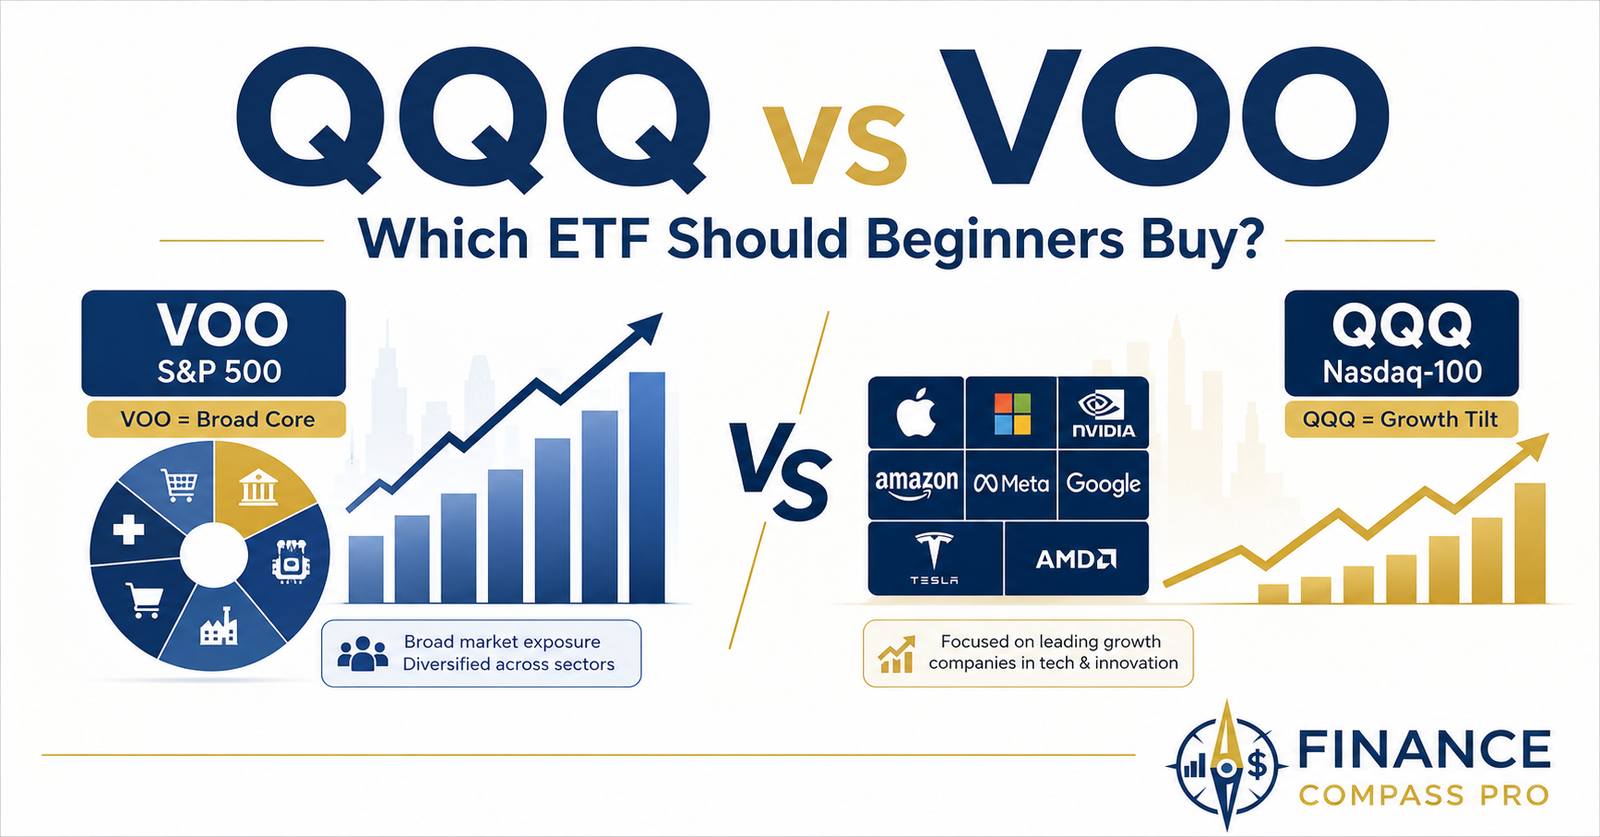
QQQ holds 100 stocks and charges 0.18%. VOO holds roughly 500 stocks and charges 0.03%. QQQ and VOO are two of the most popular ETFs among beginner investors, and they get compared constantly – but they’re built to do very different jobs.
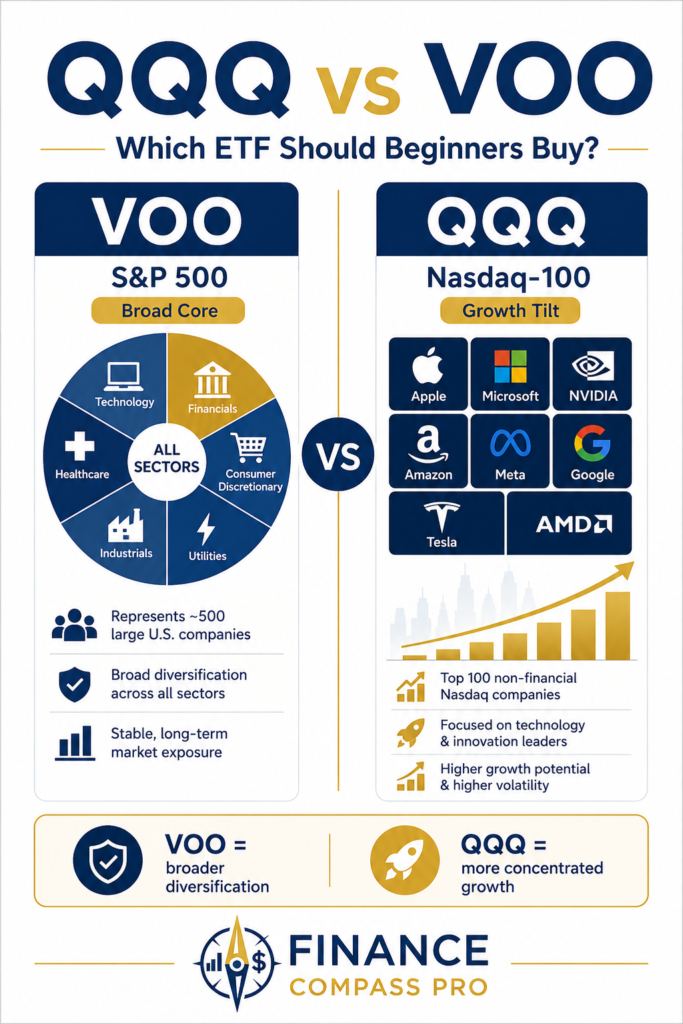
VOO tracks the S&P 500 – roughly 500 of the largest U.S. companies across every sector. QQQ tracks the Nasdaq-100 – 100 of the largest non-financial companies listed on the Nasdaq, heavily weighted toward technology.
That single difference in what each fund holds explains almost everything else: the returns, the volatility, the sector concentration, and who each fund tends to fit best.
This guide breaks down what QQQ and VOO actually hold, how they’ve performed, what the fees and tax treatment look like, and how to decide which one – or what combination of both – fits your portfolio.
What Is VOO?
VOO is the Vanguard S&P 500 ETF. It tracks the S&P 500 index, which includes roughly 500 of the largest publicly traded U.S. companies, weighted by market capitalization.
Because it’s weighted by size, the largest companies make up a disproportionate share of the fund – but it still spans every major sector: technology, healthcare, financials, consumer goods, energy, industrials, and more. For official fund details, see the Vanguard VOO product page.
For a deeper look at what the index itself represents, see our guide on what the S&P 500 is, or see VOO ETF Explained for a full breakdown of the fund itself.
VOO at a glance:
- Tracks: S&P 500
- Holdings: ~500 companies
- Expense ratio: 0.03%
- Sector exposure: Broad, all major sectors
- Issuer: Vanguard
What Is QQQ?
QQQ is the Invesco QQQ Trust. It began trading in March 1999 and tracks the Nasdaq-100 index – the 100 largest non-financial companies listed on the Nasdaq exchange. For official fund details, see the Invesco QQQ product page.
Because the Nasdaq is home to many of the largest technology companies, QQQ ends up heavily concentrated in tech – often 50% or more of the fund, depending on current market conditions. It also excludes financial companies entirely, which is a meaningful structural difference from VOO.
QQQ at a glance:
- Tracks: Nasdaq-100
- Holdings: 100 companies
- Expense ratio: 0.18%
- Sector exposure: Heavily weighted toward technology; excludes financials
- Issuer: Invesco
For a refresher on how ETFs work in general before comparing these two, see our guide on what an ETF is and how it works.
One important note: long-term buy-and-hold investors sometimes compare QQQ with QQQM, a related Nasdaq-100 ETF with a lower expense ratio. This article focuses on QQQ because it is the more widely recognized and traded fund, but beginners should know that QQQ is not the only Nasdaq-100 ETF available.
QQQ vs. VOO: Key Differences
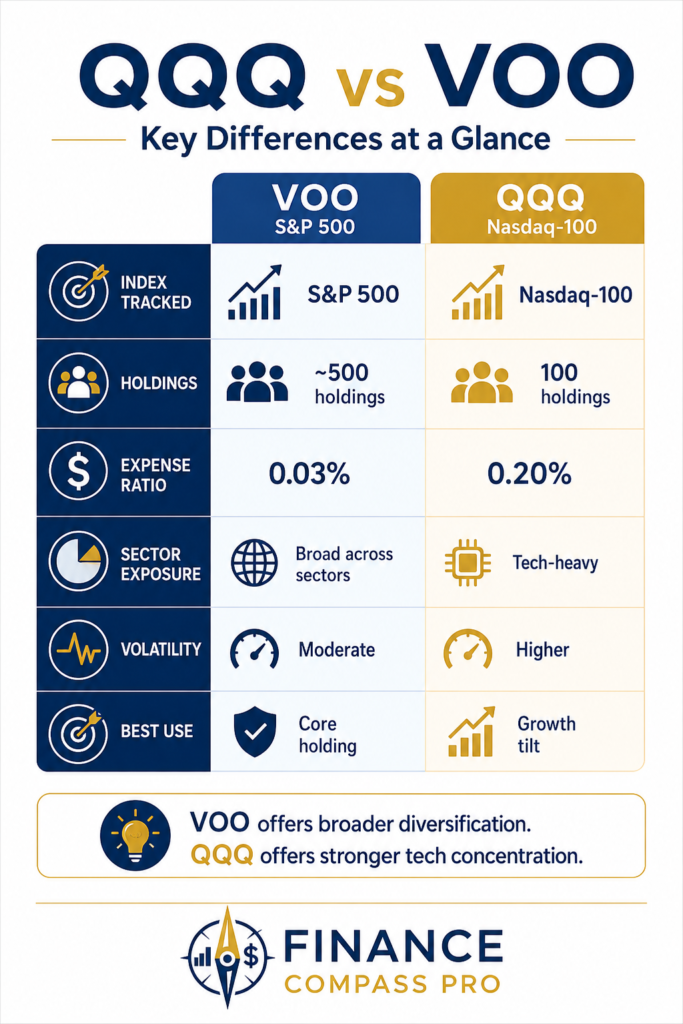
| VOO | QQQ | |
|---|---|---|
| Index Tracked | S&P 500 | Nasdaq-100 |
| Number of Holdings | ~500 | 100 |
| Expense Ratio | 0.03% | 0.18% |
| Sector Concentration | Diversified across all sectors | Heavy tech weighting |
| Includes Financials? | Yes | No |
| Typical Volatility | Moderate | Higher |
| Dividend Yield | ~1.3% | ~0.6% |
| Typical Portfolio Role | Core holding | Growth satellite or tilt |
Expense ratios, holdings, sector weights, and yields can change over time. Always verify current figures on the fund sponsor’s website before investing.
Why QQQ Has Outperformed in Recent Years – And Why That’s Not the Whole Story
Over much of the past decade, QQQ has outperformed VOO. The reason is straightforward: technology companies – many of which sit inside QQQ but make up a smaller share of VOO – have grown earnings and stock prices faster than the broader market.
But past outperformance is not a guarantee of future results, and concentrated outperformance carries a flip side: concentrated underperformance.
QQQ itself began trading in March 1999 and was hit hard during the dot-com crash. The fund declined more than 80% from its March 2000 peak before bottoming out in late 2002 – a useful reminder of what concentration risk can look like when a high-growth sector falls sharply out of favor.
This doesn’t mean QQQ is a bad fund. It means QQQ’s returns come with more volatility, and that volatility can cut in both directions depending on the period you’re invested through.
Fees: A Small Difference That Compounds
VOO’s expense ratio of 0.03% versus QQQ’s 0.18% looks like a small gap on paper, but it compounds over decades. To see exactly how fee differences add up over 30 years, see ETF Expense Ratios Explained.
On a $10,000 investment held for 20 years with no further contributions, that 0.17% difference in fees alone – separate from any difference in performance – works out to roughly several hundred dollars in cumulative cost, simply from the fee structure compounding against the balance.
Fees are not the only factor, but they are one of the few variables investors know in advance with certainty. If two funds offered similar exposure and similar expected returns, the lower-cost option would usually have an advantage over time.
Tax Considerations
Both funds are structured as ETFs, which are generally tax-efficient compared to actively managed mutual funds because of how shares are created and redeemed.
VOO’s higher dividend yield means it distributes more taxable income annually in a standard brokerage account. QQQ’s lower yield means less annual taxable income, with more of the return coming from price appreciation that isn’t taxed until you sell.
In a Roth IRA or Traditional IRA, this distinction matters much less, since dividends and growth are both sheltered from annual taxation. In a taxable brokerage account, it’s a small factor worth knowing about – not a reason on its own to choose one fund over the other.
Who Should Consider VOO?
- Investors who want broad exposure across every major sector, not just technology
- Beginners looking for a single core holding that doesn’t require sector judgment calls
- Investors who want the lowest possible fee on a broad market fund
- Anyone prioritizing diversification over the chance of outsized sector-driven returns
If you’re building a first portfolio and want a single, simple core position, VOO – or a similar total market fund – is usually the more straightforward starting point. For a closer look at how VOO compares to a total-market alternative, see our guide on VOO vs. VTI.
Who Should Consider QQQ?
- Investors who specifically want concentrated technology and growth exposure
- Long time horizons that can absorb a sharp, sector-driven drawdown without needing to sell
- Investors who already hold a diversified core (like VOO) and want a satellite position for additional growth tilt
- Higher risk tolerance and comfort with more dramatic short-term swings
QQQ tends to work better as a complement to a diversified core rather than as someone’s only holding, given its sector concentration.

Can You Hold Both?
Yes – and many investors do. Because QQQ’s largest holdings overlap significantly with VOO’s largest holdings, combining the two doesn’t create two completely separate portfolios. It tilts your overall allocation more heavily toward technology and growth than VOO alone would.
A common approach: hold VOO (or a total market fund) as the core of the portfolio, then add a smaller QQQ allocation – often 10-20% – as a growth tilt for investors who want more upside potential and can tolerate the added volatility.
If you’re deciding how dividend income fits into that same portfolio alongside growth exposure like QQQ, our guide on growth stocks vs. dividend stocks walks through that trade-off in more detail.
For a simple, structured way to combine a few funds like this into a complete portfolio, see our guide on the 3 ETF portfolio strategy.
The Bottom Line
VOO and QQQ aren’t really competing for the same role in a portfolio. VOO is a broad, diversified core holding. QQQ is a concentrated bet on technology and growth wrapped in an ETF structure, but it is not as broadly diversified or as low-cost as VOO.
Neither is automatically “better.” The right choice depends on how much sector concentration you’re comfortable with, your time horizon, and whether you’re looking for a single core holding or a growth tilt to add on top of one.
For most beginners building a first portfolio, starting with a broad core like VOO – and considering QQQ later as a smaller, deliberate addition – tends to be the more manageable path.
FAQ About QQQ vs. VOO
For most beginners, VOO is the more manageable starting point because it offers broad diversification across every major sector at a lower cost. QQQ can work as a smaller, deliberate addition for investors who specifically want more technology and growth exposure and can tolerate higher volatility.
VOO tracks the S&P 500, holding roughly 500 companies across all major sectors. QQQ tracks the Nasdaq-100, holding 100 companies heavily weighted toward technology and excluding financials entirely.
Yes. Many investors hold VOO as a diversified core and add a smaller QQQ allocation, often around 10-20%, as a growth tilt. Because the two funds overlap in their largest holdings, combining them shifts your overall allocation more toward technology rather than creating two fully separate portfolios.
READY TO KEEP BUILDING?
- Best ETFs for Beginners in 2026
- QQQ vs. QQQM: Which Nasdaq-100 ETF Makes More Sense for Long-Term Investors?
- QQQ ETF Explained: What It Holds and Who It Is Designed For
- $500 in an S&P 500 ETF: What Happens After 10, 20, and 30 Years?
Disclaimer: This article is for educational purposes only and does not constitute personalized financial or investment advice. Past performance does not guarantee future results. Index compositions, expense ratios, and yields change over time – verify current figures before investing. Consult a qualified financial professional for advice specific to your situation.