Disclosure: This post is for informational and educational purposes only. FinanceCompassPro.com may earn compensation through display advertising. We may also reference third-party products, services, or platforms by name for educational purposes – these mentions are not paid endorsements unless explicitly stated. Nothing in this post constitutes personalized financial, legal, tax, or investment advice.
Many beginners agonize over VTI versus VOO as if the wrong pick could sink their portfolio. The data says otherwise.
VTI and VOO are the two most common starting points for beginner investors at Vanguard.
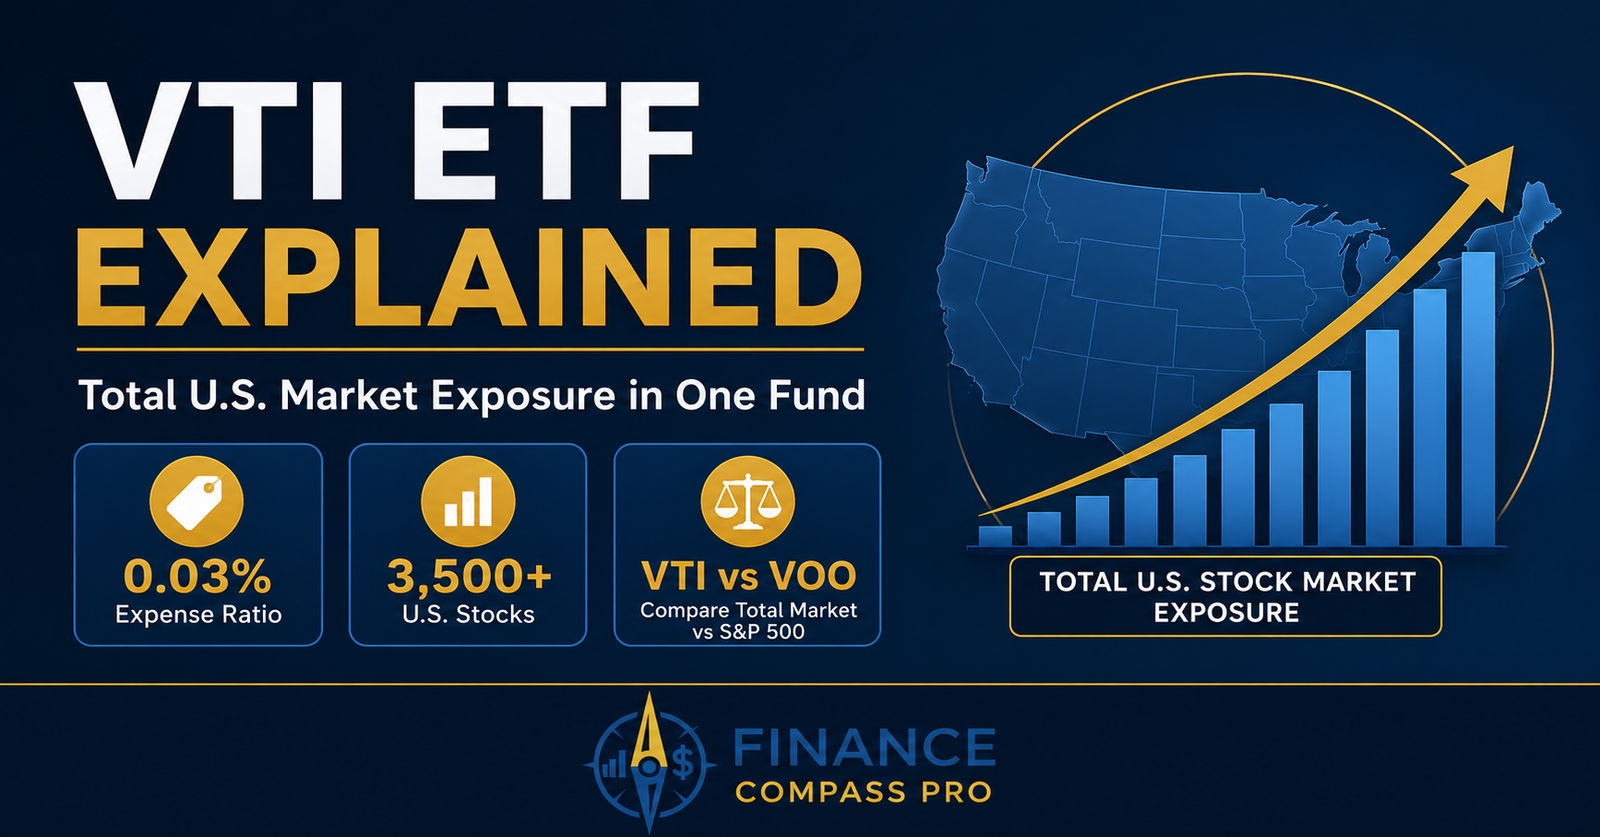
They share the same ultra-low 0.03% expense ratio, follow passive indexing strategies, and have become core holdings in millions of long-term portfolios.
However, they answer a slightly different question. VOO asks: which 500 large U.S. companies should I own? VTI asks: which U.S. companies should I own – and the answer is all of them, roughly 3,500 in total.
This guide covers what VTI actually holds, how its total-market approach differs from VOO’s S&P 500 focus, and how to decide which one – or whether either – fits your portfolio. If you are new to ETFs, see What Is an ETF? before reading on.
Quick Answer: VTI is the Vanguard Total Stock Market ETF. It holds roughly 3,500 U.S. stocks – large, mid, and small-cap – for a 0.03% expense ratio. Its long-term returns have closely tracked VOO, which charges the same fee. Therefore, for most long-term investors, either fund works well as a core U.S. equity holding.
What Is VTI?
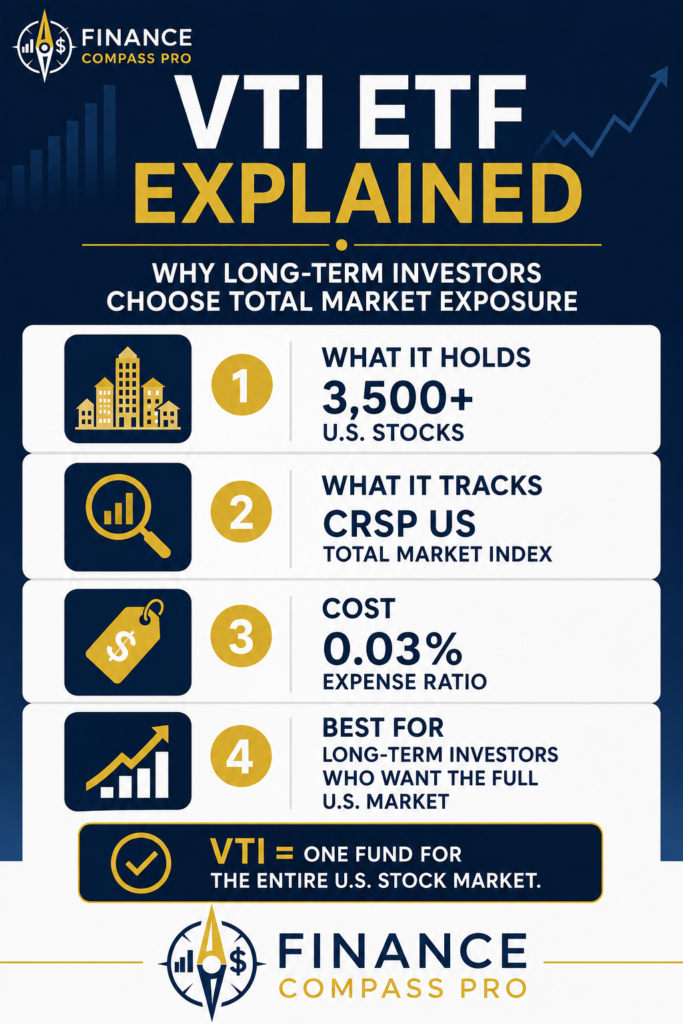
VTI is the Vanguard Total Stock Market ETF. It tracks the CRSP US Total Market Index – a comprehensive index designed to represent 100% of the investable U.S. stock market. That means large-cap, mid-cap, and small-cap companies across growth and value styles are all included.
VTI uses a broad indexing approach designed to closely track the CRSP US Total Market Index. Because the index includes thousands of stocks, the fund may use sampling and optimization techniques, but its practical goal is still broad total U.S. market exposure.
| Feature | VTI ETF |
|---|---|
| Full name | Vanguard Total Stock Market ETF |
| Index tracked | CRSP US Total Market Index |
| Coverage | Large, mid, and small-cap U.S. stocks |
| Expense ratio | 0.03% |
| Issuer | Vanguard |
| Number of holdings | ~3,500+, varies over time |
| Legal structure | Open-ended ETF |
| Launched | May 2001 |
For official fund details, see the Vanguard VTI product page. Holdings, yields, and sector weights fluctuate over time – verify current figures before investing.
What Does VTI Actually Hold?
VTI currently holds over 3,500 U.S. stocks across every sector and market-cap range. Technology dominates the top holdings – companies like NVIDIA, Apple, Alphabet, Microsoft, and Amazon currently make up the largest positions by weight.
Together, the top 10 holdings represent roughly one-third of the fund, reflecting the outsized influence of mega-cap technology in the U.S. market.
Beyond those large-cap names, VTI also includes thousands of mid-cap and small-cap companies that never appear in VOO’s portfolio.
These smaller companies collectively represent only a modest share of VTI’s total weight – because VTI is market-cap weighted, smaller companies naturally occupy smaller positions.
However, their inclusion gives VTI some exposure to parts of the market that VOO excludes.
In terms of sector exposure, VTI looks similar to VOO at the top – technology, financials, healthcare, and consumer discretionary are the largest sectors in both funds.
The difference emerges in the breadth of the holding list, not the top-level sector weights.
VTI vs. VOO: Total Market vs. S&P 500
This is the central comparison for most VTI decisions. Since both funds come from Vanguard, charge the same 0.03% expense ratio, and have produced remarkably similar long-term returns, the real difference lies elsewhere. So what is actually different?
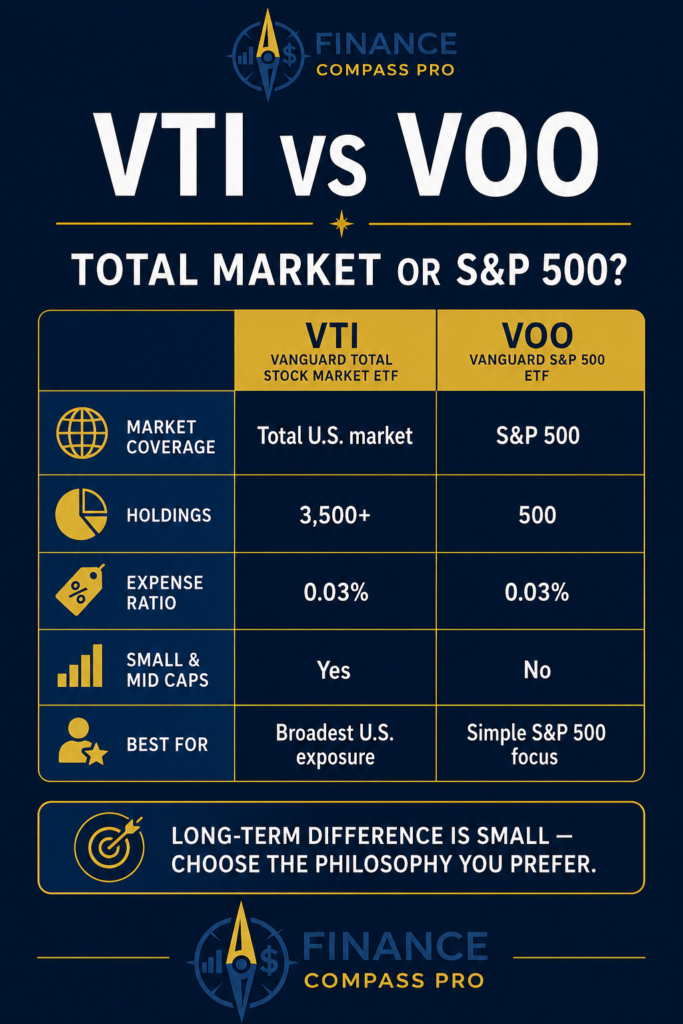
| VTI | VOO | |
|---|---|---|
| Index | CRSP US Total Market (~3,500 stocks) | S&P 500 (~500 large-cap stocks) |
| Expense ratio | 0.03% | 0.03% |
| Includes small/mid-cap | Yes | No |
| U.S. market coverage | ~100% by cap | ~80% by cap |
| Top 10 concentration | ~33% of fund | ~36% of fund |
| Long-term return difference | Very similar to VOO | Very similar to VTI |
The most important point in this table is the last row. Because large-cap stocks dominate both indexes, VTI and VOO have historically produced very similar total returns over long periods.
Periods where small-cap stocks outperform give VTI a slight edge; periods where large-cap stocks dominate (as in much of the 2010s and early 2020s) tend to slightly favor VOO. Neither has a consistent, durable advantage over the other.
For the full side-by-side comparison, see VOO vs. VTI.
The Case for VTI Over VOO
Investors who prefer VTI typically do so for one or more of the following reasons.
Broader diversification. VTI covers roughly 3,500 companies versus VOO’s 500. While the return difference has been small historically, VTI does give exposure to small and mid-cap companies that have sometimes outperformed large-caps over long periods.
Some research has found that smaller companies have outperformed large companies over certain long periods. However, that pattern has been inconsistent, and small-cap exposure does not guarantee higher returns.
True total-market coverage. VTI is designed to represent 100% of the investable U.S. equity market. Investors who believe in holding “the whole market” rather than a curated large-cap list tend to prefer this philosophy.
As a result, VTI requires no decisions about which companies are large enough to count.
Slightly lower concentration. VTI’s top 10 holdings represent roughly one-third of the fund, compared to a slightly higher concentration in VOO.
For investors who are already concerned about mega-cap technology dominance, VTI dilutes that concentration marginally through its broader base of holdings.
The Case for VOO Over VTI
Investors who prefer VOO typically point to a few practical advantages.
Simpler benchmark. The S&P 500 is the most widely followed stock market index in the world. For investors who want their portfolio to track something they can easily follow in the news, VOO is the direct expression of that index.
Proven long-term track record. VOO’s underlying index – the S&P 500 – has decades of documented return data and is arguably the most studied index in finance.
Many investors are simply more comfortable with a fund that tracks something as established and well-understood as the S&P 500.
Larger trading and options ecosystem. The S&P 500 ETF ecosystem generally has deeper trading and options markets, especially through SPY. For investors who may want to use options strategies, SPY is usually the more relevant comparison than VOO or VTI. For the full breakdown of SPY, see SPY ETF Explained.
Expense Ratio: A True Tie
VTI and VOO both charge 0.03% per year. On a $10,000 investment, that is $3 annually for either fund. There is no cost advantage to choosing one over the other. For a deeper look at how even small expense ratio differences compound over decades, see ETF Expense Ratios Explained.
Tax Efficiency
VTI is highly tax-efficient, for the same structural reasons as VOO. As an open-ended ETF, it uses in-kind redemptions to minimize capital gains distributions. VTI has historically distributed little or no capital gains to shareholders in taxable accounts.
Many dividends from VTI may qualify for the lower qualified-dividend tax rate if holding-period requirements are met, though your Form 1099-DIV is the source of truth each year.
In taxable accounts, holding VTI and VXUS separately can provide more tax-loss harvesting flexibility than holding VT, because the U.S. and international pieces can be managed separately.
For the full picture of how ETF account placement affects after-tax returns, see ETF Taxes Explained.
Where VTI Fits in a Portfolio
Like VOO, VTI is a core equity holding – not a satellite position. The two serve the same role: the U.S. equity component of a diversified portfolio. Adding both does not improve diversification; it simply duplicates the same market exposure.
A classic 3-fund portfolio pairs VTI (or VOO) with VXUS for international exposure and BND for bonds. Together, these three holdings cover the global equity market plus investment-grade fixed income. For the full framework, see The 3-ETF Portfolio Strategy. For the international component, see VXUS ETF Explained.
If you are still deciding how much of your overall portfolio should go into U.S. stocks versus international stocks versus bonds, see our guide on asset allocation.
Beginner Decision: VTI or VOO?
This is the practical question VTI creates for most beginners. Here is how to think through it.
| If you prefer… | Consider… |
|---|---|
| Owning the full U.S. market including small/mid-cap | VTI |
| Tracking the most widely followed benchmark | VOO |
| Slightly lower mega-cap concentration | VTI |
| Maximum S&P 500 trading and options ecosystem | VOO (or SPY) |
| Keeping it simple with no meaningful preference | Either – the long-term difference is small |
The most important thing to understand is that neither VTI nor VOO is objectively better. They represent different philosophies about what “the U.S. market” means – 500 large companies or the full investable universe – not different levels of quality. Both are excellent long-term tools at the same cost.
FAQ About VTI
A. For many beginners, yes. VTI covers the entire investable U.S. stock market in one fund at a 0.03% expense ratio. As a result, it removes the need to pick individual stocks or sectors. However, it is still 100% stocks, so it carries full equity market volatility.
A. VTI tracks the CRSP US Total Market Index with roughly 3,500 stocks. VOO tracks the S&P 500 with about 500 large-cap stocks. Both charge 0.03%. Because large-caps dominate both indexes, their long-term returns have been very similar. The main difference is VTI’s added small and mid-cap exposure.
A. Yes. VTI pays quarterly dividends from the thousands of dividend-paying companies it holds. Many of those dividends may qualify for the lower qualified-dividend tax rate if holding-period requirements are met. However, your Form 1099-DIV is the source of truth each year.
A. Usually not. VOO’s 500 companies are already inside VTI, so holding both duplicates the same exposure rather than diversifying it. Instead, most investors pick one as their U.S. core and pair it with international and bond funds.
A. VTI holds roughly 3,500 U.S. stocks across every sector. Historically, mega-cap names like NVIDIA, Apple, Microsoft, Alphabet, and Amazon have made up the largest positions. The top 10 holdings represent roughly one-third of the fund. Holdings change over time, so verify current data before investing.
A. VTI works well in both. It is highly tax-efficient in taxable accounts because it rarely distributes capital gains. In a Roth IRA, its long-term growth compounds tax-free. Therefore, the better placement depends on your overall account mix and goals rather than the fund itself.
The Bottom Line
VTI is one of the most straightforward long-term investments available. It holds roughly 3,500 U.S. stocks at a 0.03% expense ratio, covering the entire investable U.S. equity market in a single fund. Its long-term returns have closely tracked VOO, while its broader holdings provide modest exposure to small- and mid-cap companies that the S&P 500 excludes.
For many long-term investors, the choice between VTI and VOO is less important than building a portfolio they can hold consistently over time. Either fund provides a solid foundation. The more meaningful decisions come next: how much to allocate to international stocks like VXUS, how much to allocate to bonds like BND, and how to structure the overall portfolio to match your timeline and goals.
Want to compare the two Vanguard funds directly? VOO vs. VTI explains the key differences, while VOO ETF Explained takes a closer look at the S&P 500 approach.
If you’re considering adding more growth-oriented exposure, QQQ ETF Explained shows how a Nasdaq-100 fund differs from a total-market portfolio.
VTI also works well alongside international diversification. VXUS ETF Explained covers how the two funds complement each other, and ETF Tax-Loss Harvesting Explained shows why many taxable investors pair VTI with VXUS as part of a tax-loss harvesting strategy.
For the broader picture of how core, dividend, international, bond, and growth ETFs fit together, see ETFs for Beginners: How to Choose, Compare, and Build a Simple Portfolio.